61 466 986 389
State Nomination Allocations 2025–26: What Changed, Who Benefited, and What It Means for You
November 19, 2025
2025–26 state and territory nomination allocations, and the landscape has shifted noticeably.
This year, Australia has reduced total nomination placesand reshuffledhow those places are distributed across states. Some states gained, some lost, and the overall message is clear: the government is recalibrating permanent migration away from the major cities and towards regional Australia.
🔗Official source:
State and Territory Nomination Allocations – Department of Home Affairs
https://immi.homeaffairs.gov.au/what-we-do/state-and-territory-nomination-allocations
1. National Overview — A Smaller Program
- 2024–25 Total:26,260 places
- 2025–26 Total:20,350 places
- Net reduction:–5,910 places (–22.5%)
This is one of the sharpest single-year contractions in recent years and directly impacts the chances of skilled migrants seeking state nomination.
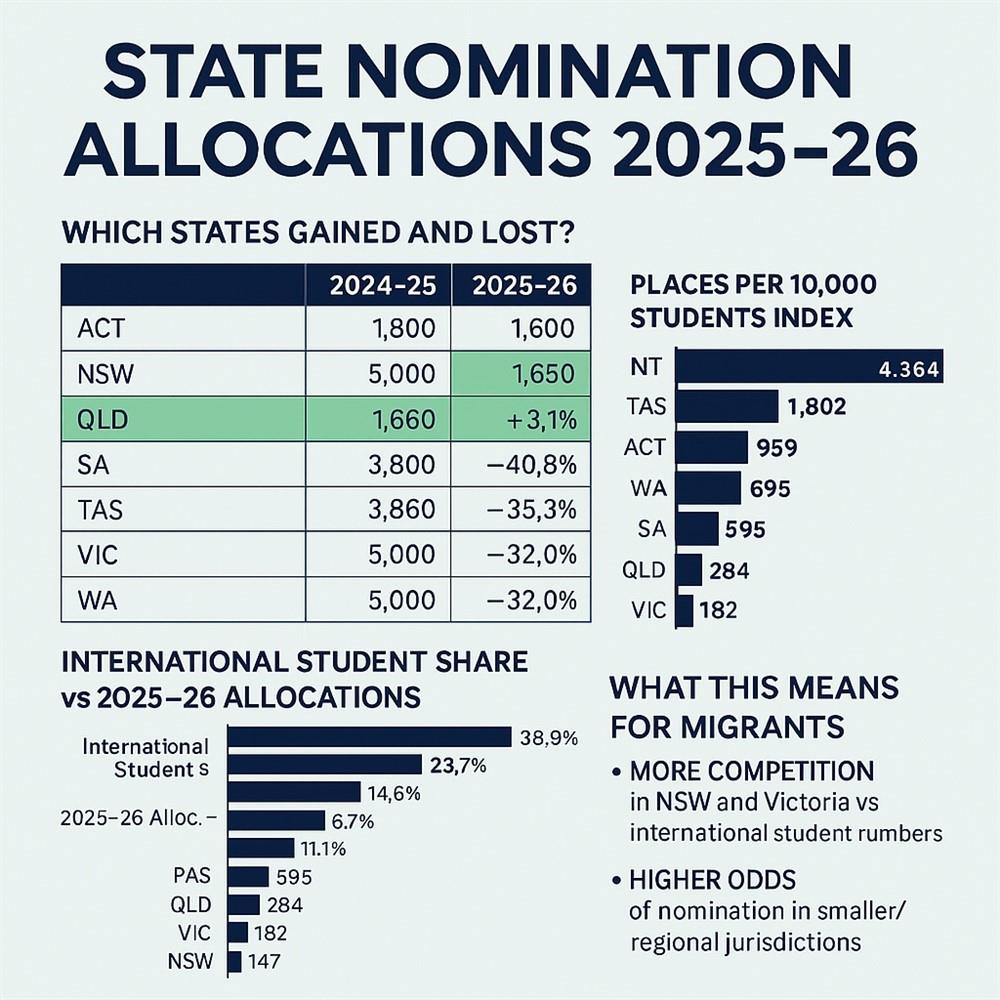
2. Which States Gained and Which Lost?
Year-on-year change (all subclasses 190 + 491)
State/Territory | 2024–25 | 2025–26 | Change | % Change |
ACT | 1,800 | 1,600 | –200 | –11.1% |
NSW | 5,000 | 3,600 | –1,400 | –28% |
NT | 1,600 | 1,650 | +50 | +3.1% |
QLD | 1,200 | 2,600 | +1,400 | +116.7% |
SA | 3,800 | 2,250 | –1,550 | –40.8% |
TAS | 2,860 | 1,850 | –1,010 | –35.3% |
VIC | 5,000 | 3,400 | –1,600 | –32% |
WA | 5,000 | 3,400 | –1,600 | –32% |
Clear winners
- Queensland– allocations more than doubled.
- Northern Territory– slight increase.
Clear losers
- South Australia, Tasmania, Victoria, WA and NSW– each received significant cuts.
The shift signals federal preference for distributing skilled migrants more evenly, reducing pressure on Sydney/Melbourne, and strengthening regional workforce pipelines.
3. The Critical Insight — Student Numbers vs Nomination Allocations
This is where it gets interesting.
Australia’s international students + Temporary Graduate (485)holders are not evenly distributed.
Around 70%of them live in NSW and Victoria.
But the allocations do NOT match the student population.
International Student Distribution (Proxy for student + 485 population)
(Department of Education dataset — indicative state split)
State | Student Share (%) |
NSW | 38.8% |
VIC | 29.7% |
QLD | 14.6% |
WA | 6% |
SA | 6% |
ACT | 2.7% |
TAS | 1.6% |
NT | 0.6% |
2025–26 Nomination Allocation Share
State | Allocation Share (%) |
NSW | 17.7% |
VIC | 16.7% |
QLD | 12.8% |
WA | 16.7% |
SA | 11.1% |
ACT | 7.9% |
TAS | 9.1% |
NT | 8.1% |
The imbalance
- NSW + VIC hold ~69% of students but only ~34% of nomination places.
- Regional states (NT, TAS, WA, SA, ACT)receive allocations far larger than their student populations.
This creates a “per-student advantage”for smaller states.
4. The Competitiveness Index — Places per 10,000 Students
This metric shows how accessible state nomination is, relative to student population.
State | Nomination places per 10,000 students |
NT | 4,364(extremely favourable) |
TAS | 1,802 |
ACT | 959 |
WA | 895 |
SA | 595 |
QLD | 284 |
VIC | 182 |
NSW | 147(least favourable) |
Interpretation
- Migrants in NT, TAS, ACT, WA, SAenjoy significantly higher accessto state nomination pathways.
- Migrants in NSW and VICface much tougher competitiondue to the mismatch between demand (huge student cohorts) and supply (lower allocations).
5. What This Means for Migrants
If you’re in NSW or VIC
- Expect strong competitionfor 190 and 491 nominations.
- Points maximisation, priority occupations, and alternative pathways (482/186, DAMA, regional moves) become essential.
If you’re in QLD, WA, SA, TAS, ACT, or NT
- Your relative chances are significantly higher, provided you meet each state’s criteria.
- Regional commitment, local work experience, and occupation alignment matter more than ever.
For 485 holders
- Time is limited, and places are fewer.
- Early planning (skills assessment, English, state requirements) is critical.
6. Final Thoughts
The 2025–26 allocations show a clear strategic message from the Australian Government:
👉More skilled migrants are expected to settle, live, and work outside Sydney and Melbourne.
👉Regional and smaller states now offer a much stronger return-on-effort for students and 485 visa holders.
If you’re planning your permanent residency pathway, this year’s numbers show that where you live and work matters more than ever.
CATEGORIES
LATEST NEWS